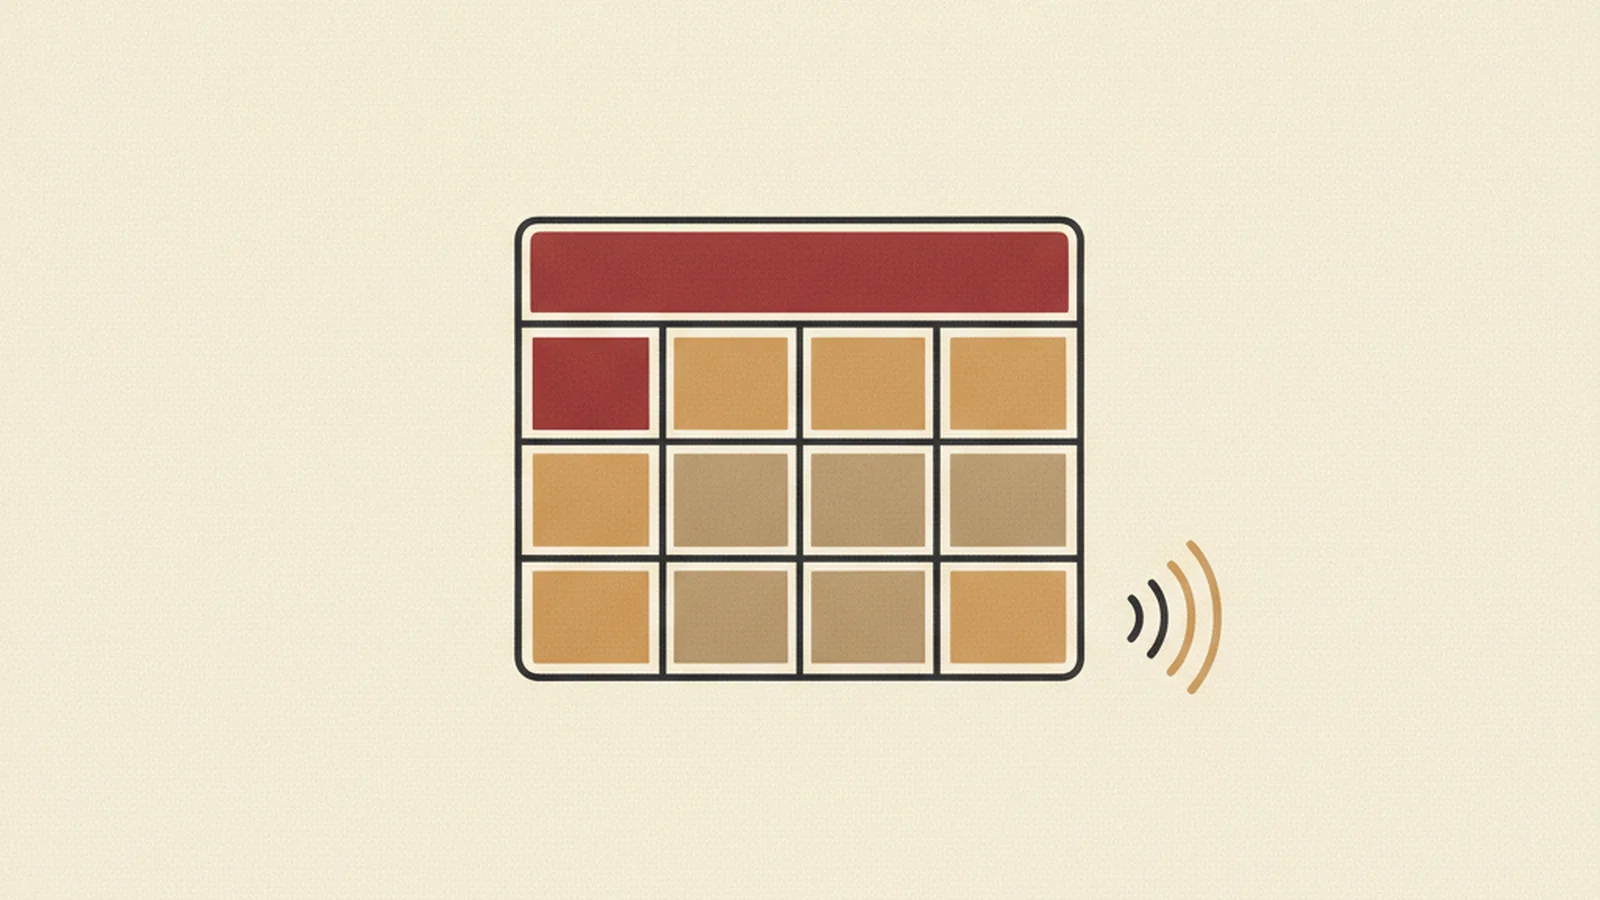
Picture your pricing page. Three plans across the top, five feature rows down the side, a clean grid with just enough oxblood shading to make the recommended plan stand out. Visually, it is exactly the kind of table a designer is proud to ship.
Now put a screen reader on it. Strip away the borders, the shading, the visual grouping your eye does automatically, and what is left is a flat, unbroken stream: a number, then another number, then another, with no row label and no column label attached to any of them. If every cell in that table is a plain <td>, a screen reader user does not hear "Pro plan, monthly price, $49." They hear "$49," floating with no anchor, followed by "$99," floating with no anchor, and no way to tell which plan or which billing cycle either one belongs to.
That gap, between what a table looks like and what a table sounds like, is where most accessible-table failures actually live. Not missing alt text. Not color contrast. Just plain cells quietly doing a header's job, and nobody noticing until a real user gets stuck.
The Stat: Roughly 1 in 4 US adults, 28.7%, report living with a disability, a population that regularly needs to read tabular data like pricing, schedules, and statements. (Source: CDC)
The Checklist Nobody Runs Until It's Too Late
We already covered the one markup mistake that turns a table into noise, which is missing scope on header cells. If you have not fixed that yet, it is the one mistake most worth fixing first, because it silently breaks more tables than anything else on this list.
But scope is only one item on a longer list. A table can have perfect column scope and still be unusable if it has no caption, no plan for merged cells, or no fallback once it hits a phone screen. Below is the full checklist, in the order we would actually work through it on a real table.
1. Give It a Caption
Every data table needs a <caption> element as its first child, stated in plain language: "Quarterly Pricing Comparison," not just a heading floating nearby in the page layout. A visual heading above a table is not programmatically connected to it. A <caption> is. It is the first thing a screen reader announces when a user lands on the table, and it is what tells them, before they hear a single cell, what they are about to read. For a genuinely complex table, pair the caption with a short one-line summary of how the table is organized, so the reader can build a mental map before diving into cells.
2. Mark Every Column Header with scope="col"
Every header cell sitting at the top of a column needs to be a real <th> element, not a bolded <td>, with scope="col" set explicitly. This is the single association that lets a screen reader announce "Annual price, $490" instead of just "$490." The WAI tables tutorial walks through this exact pattern with working examples, and it is worth bookmarking, because it is the reference we go back to whenever a table's structure gets even slightly unusual.
3. Mark Every Row Header with scope="row"
The mirror image of item two, and the one teams forget most often. If your table has a header down the left side, "Storage," "Support," "Team Seats," each of those needs to be a <th scope="row">, not a styled <td>. Without it, a user tabbing down a column of checkmarks hears "yes, yes, no" with no idea which feature each answer belongs to. Row headers matter just as much as column headers, and in our experience they get skipped more often, probably because visually a bolded first column already looks "done."
4. Use headers and id for Irregular or Multi-Level Tables
Simple scope="col" and scope="row" only work cleanly when a table has one row of headers and one column of headers. The moment you have grouped column headers, a two-level header spanning several sub-columns, or a table where a single cell logically belongs to more than one header, scope alone cannot describe the relationship. That is when you switch to the headers/id technique: give every header cell a unique id, and on every data cell, list the ids of all the headers that apply to it in a headers attribute. It is more typing, but it is the only reliable way to describe a genuinely irregular table, and WCAG technique H51 documents the pattern in detail. If your data is coming out of a spreadsheet export, it is worth reading our piece on structuring accessible spreadsheets in Excel and Google Sheets first, since a badly structured source sheet tends to produce a badly structured HTML table on the other end.
5. Avoid Merged Cells Wherever Possible
Merged cells, colspan and rowspan stacked several layers deep, are where table accessibility goes to die. Each merge adds another relationship a screen reader has to track, and past two or three levels, most users lose the thread entirely, sighted or not. Before reaching for a merge, ask whether the table could instead be split into two smaller tables, or whether the merged label could just be repeated in each cell it applies to. A little repetition in the markup is almost always easier for a real person to follow than a cell that silently spans four rows.
6. Build a Responsive Card-View Fallback for Mobile
A wide table squeezed into a narrow phone screen usually gets shrunk down, scrolled sideways, or truncated, and all three are hard to use for everyone, not just users of assistive technology. The sturdier pattern is a card view: at narrow widths, each row becomes its own labeled block, with the row's header repeated as a visible label next to each value. Done well, this is a pure CSS and layout change, the underlying <table> markup, captions, and scoped headers stay exactly as they are, so screen reader users get the same well-structured table regardless of viewport width.
7. Handle Sortable Columns with aria-sort
If a column header is also a sort button, the button itself needs a clear accessible name ("Sort by annual price"), and the header cell needs aria-sort set to ascending, descending, or none, updated live every time the sort changes. Skip this and a screen reader user can trigger a sort with no idea it happened, since the visual arrow icon that tells sighted users the state changed is invisible to them.
Run the List Once, Then Make It a Habit
None of these seven items is difficult on its own. What makes tables hard is that a table can pass six of them and still fail the seventh, and the failure is invisible unless someone is actually listening with a screen reader rather than just looking at the rendered grid. Treat this checklist the way you would treat a pre-launch review for a signup form: run it deliberately, in order, every time a new table ships, rather than trusting that "it looks fine" is the same thing as "it reads fine."
If you want a second set of ears on a table before it goes live, that is exactly the kind of check our free tools are built for, no account needed to run a quick pass over your markup.
Want a person to walk through it with you instead of a checklist? Email experts@wcag.world and someone on our team will look at the actual table with you, or start with our free tools to get a first read in minutes.